Every ad campaign AdNode runs answers to what you are trying to accomplish. Not a dashboard metric: the business objective you are measured on.
The hard part is that no single number is that objective. Leads can be the wrong leads. Visits can be people who leave. Engagement isn’t a sale, a sale isn’t a lifetime customer, and lifetime value arrives too late to steer a campaign by. So the work is choosing the numbers that stand in for the objective, in the right order, and organizing everything we show you around them. That is the art in the art of analytics. Here is how we do it.
The measurement framework
1. The business objective. Where you want the business to be, in your terms, written into the plan before a dollar moves. For a growth goal, we count the actions your own records consider real: a purchase, an application, a booked consult. For a brand goal, we run a brand study and judge the campaign on lift, then look for the same movement elsewhere: branded search, direct traffic, search interest, and how often AI assistants bring you up unprompted. One study is a result. Several signals moving together is a trend.
2. Primary KPIs. The few metrics that tell you, ahead of the objective, whether it is going to be hit. For a growth goal, that is usually what visitors from each channel do once they arrive: whether they stay, read, and go on to a second page. For a brand goal, it is recall and consideration among the people reached. These are the numbers that change a plan mid-flight.
3. Media metrics. Reach, frequency, impressions, CPM, click rate. They explain how much of the work got done and at what price. They are diagnostics, and they sit at the bottom on purpose: we never put a media metric ahead of a primary KPI, we do not chase cheap CPMs that bring low-quality traffic, and we do not chase click rates that end in zero-second visits.
Click a tier to read it.
Every report follows that order, top down. When you ask whether it is working, the answer is on the first line.
The framework in action
SS&C ALPS Advisors' EQL, an Equal Sector Weight ETF ten years old with about $500 million under management, needed advisors to consider it. The objective was written first: consideration among financial advisors, measured by a controlled brand study. The plan followed from it: advisor-targeted display on the financial press, connected TV on the three finance networks, and out-of-home around one advisor conference, for under $400,000 all in.
What the order of precedence did
Because the objective came first, the study was designed to answer it and nothing else: one targeting method, so the connected TV was deliberately kept out of the study rather than mixed in; a control group; enough impressions to be sound; the questions asked the standard way. Reach, CPM and completion rate were reported too, as diagnostics. Had the report led with them, 29 million impressions would have looked like the result, and nobody would have known whether an advisor's mind had changed.
Mike presented the design at the Gramercy Institute: Brand campaigns that stand up to CFO scrutiny. More results, with figures, are shared on a call with the client's permission.
What clients see in their reporting
Your reporting is organized the same way, and we are deliberate about every figure on it. Every screen is here.
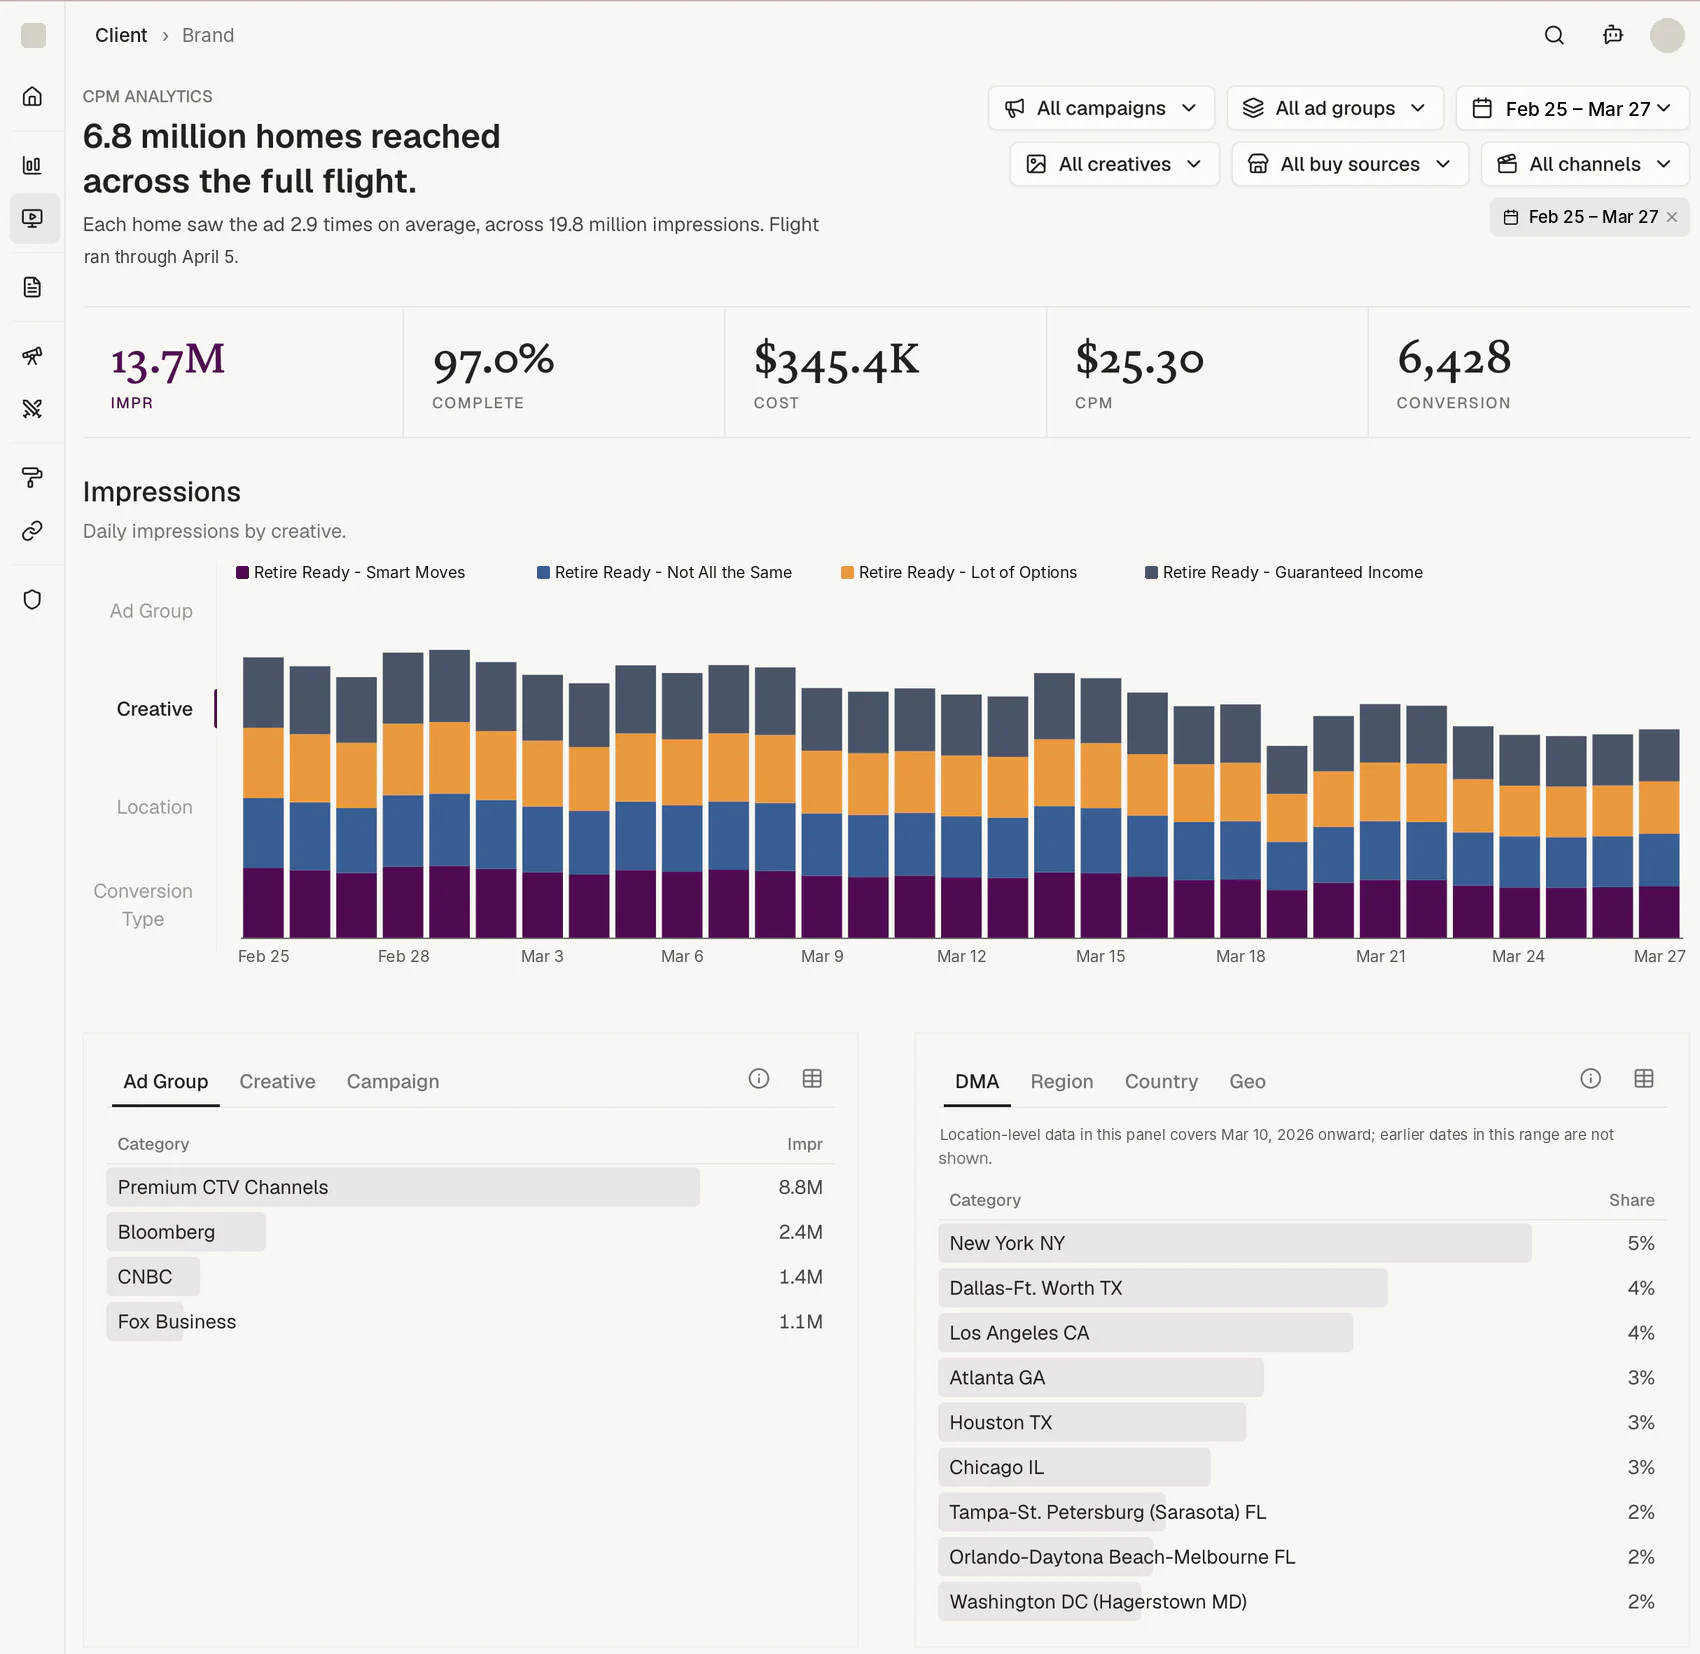
Reach is one sentence, and it does not add. A campaign's reach reads as "6.8 million homes reached across the full flight. Each home saw the ad 2.9 times on average, across 19.8 million impressions."
One campaign at a time, because unique reach cannot be summed across campaigns, and we would rather show you one true number than a bigger false one.
And the visits that follow an ad are counted, even without a click. On that flight, 16,187 site visits were matched to homes that had seen the ad on TV, and about 250 a day were still arriving after the last impression ran. The match runs on privacy-safe identifiers such as UID2 rather than cookies or view-through windows, so it holds up where those don't, and the visits are read against site engagement so a match that doesn't behave like a visitor doesn't count for much.
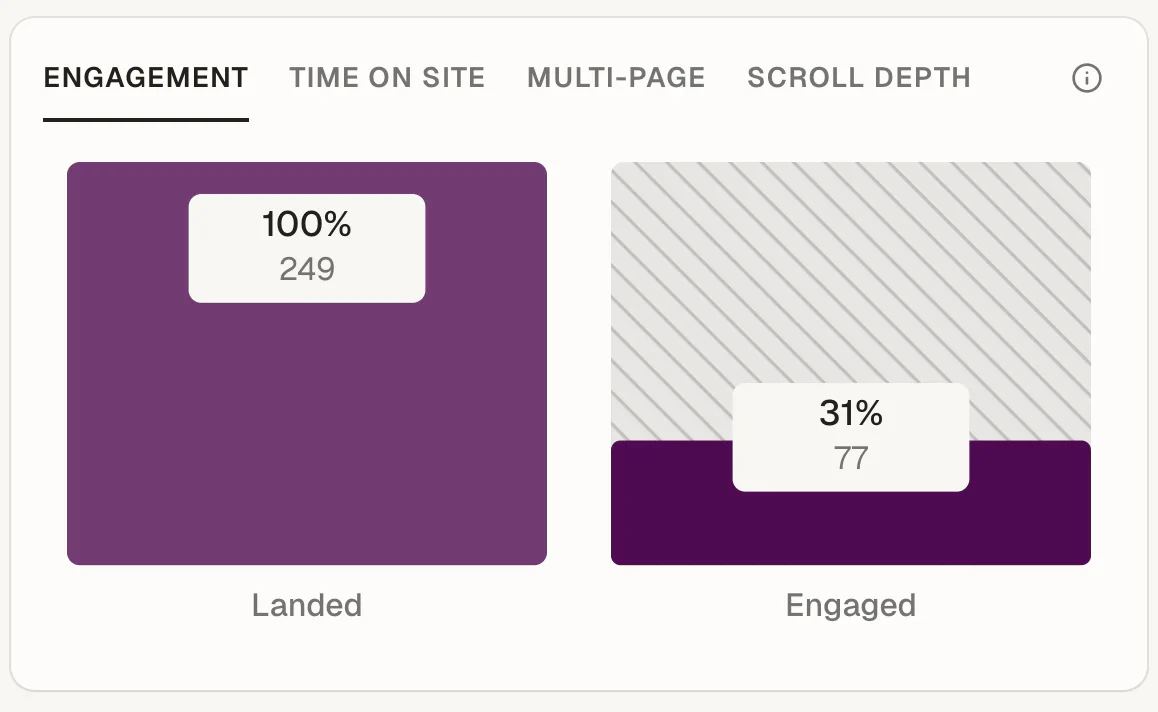
Engagement is read from your site, not from click counts. Clicks tell you who arrived. Your own analytics tell you who stayed.
For any channel, campaign, or campaign parameter, you see how many sessions landed and how many went on to engage: stayed active past ten seconds, read a second page, scrolled to the end, or converted.
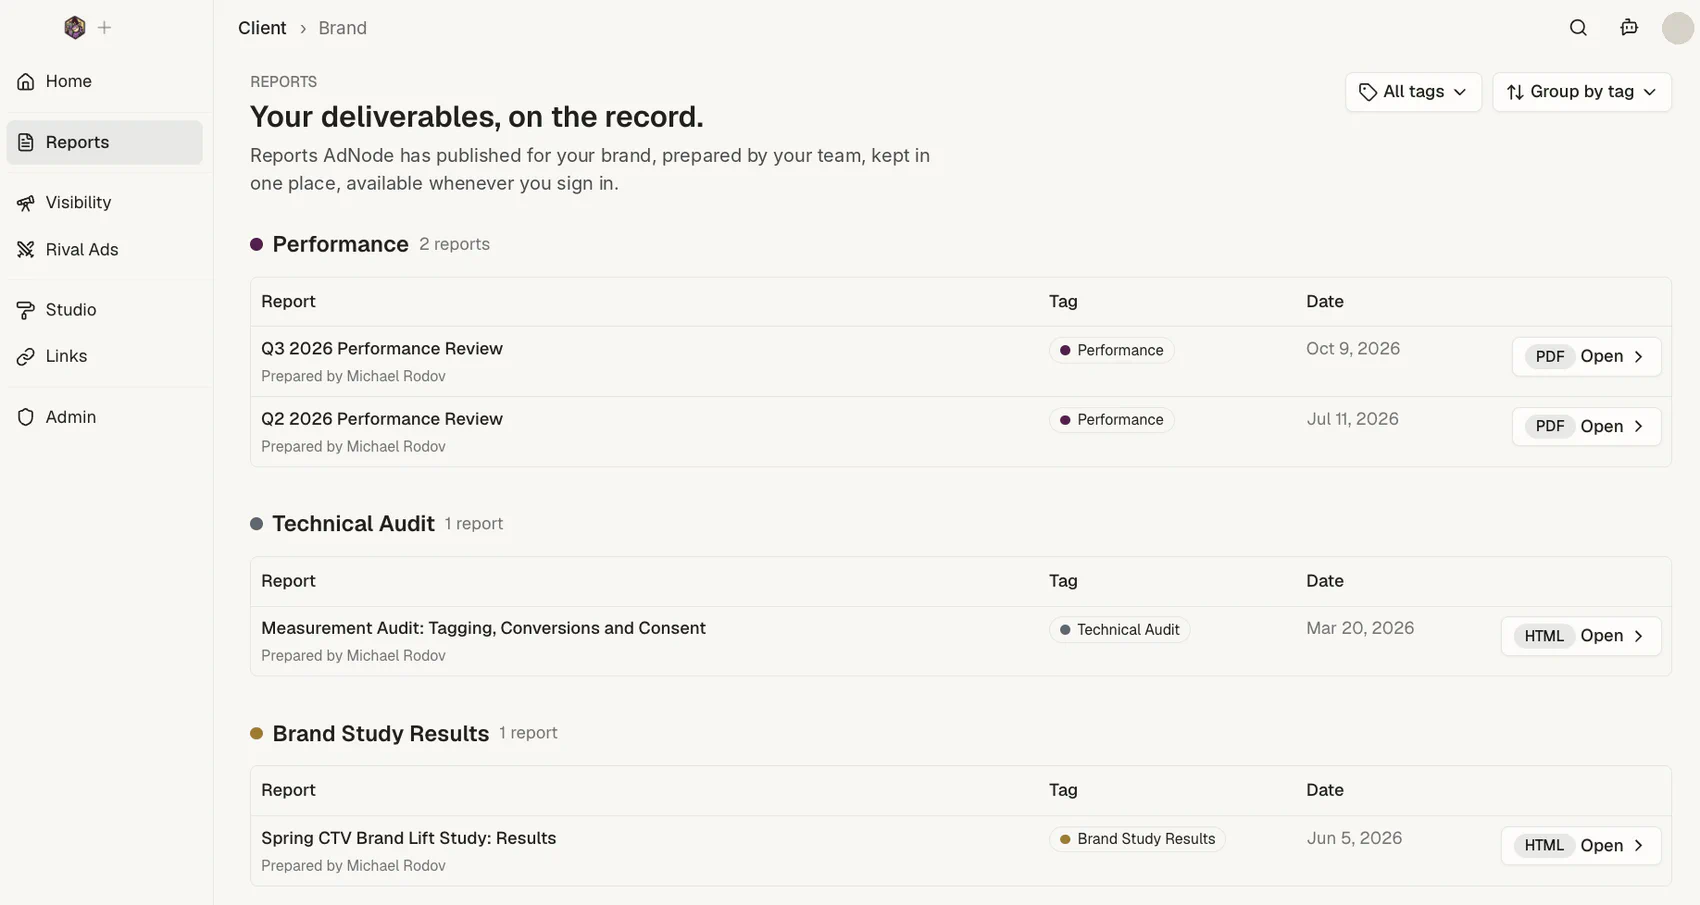
Your presentations live beside your results. Performance reviews, media plans, recommendations, brand study results, technical audits: everything we present to you is kept in one place, next to the media results it was drawn from.
The context behind each decision stays with the numbers, so every campaign builds on the last instead of starting over.
Conversions are your events, in your words. Each line is a tracking event set up for your brand, named the way you name it, and cost per action is spend over that same count. Nothing is defined twice.
Every panel says what it shows and what it leaves out. Where conversions are not reported by geography, the panel says so and shows impressions instead. Nothing on the screen asks you to guess.
Built around your objective. Which cards appear, what they are called, and the order they sit in are set for each client, so the page reads in the order your goal is measured.
The people who built the plan read the numbers. There is no reporting team between you and the person who placed the buy. The analysis is written and presented by the same senior people who made the decisions it covers.
Measurement audits: before we trust a number
Before we report against your conversions, we check that they are being measured correctly. Which tags fire on which pages. What each ad platform is told at the moment of conversion. What the consent layer actually does. Whether the conversions a platform claims reconcile with what your own records show. Most of this we can check from the outside. With read-only access, we reconcile platform by platform, and the gap is explained line by line rather than averaged away.
The simplest audit is a real transaction. For a New York attraction, we bought one ticket and recorded everything that fired: a single $42.50 purchase sent nineteen purchase signals to fifteen ad accounts, two platforms counted a conversion on every page view, and a newsletter signup reached no ad platform at all. Every platform was over-reporting sales, and each by a different amount.
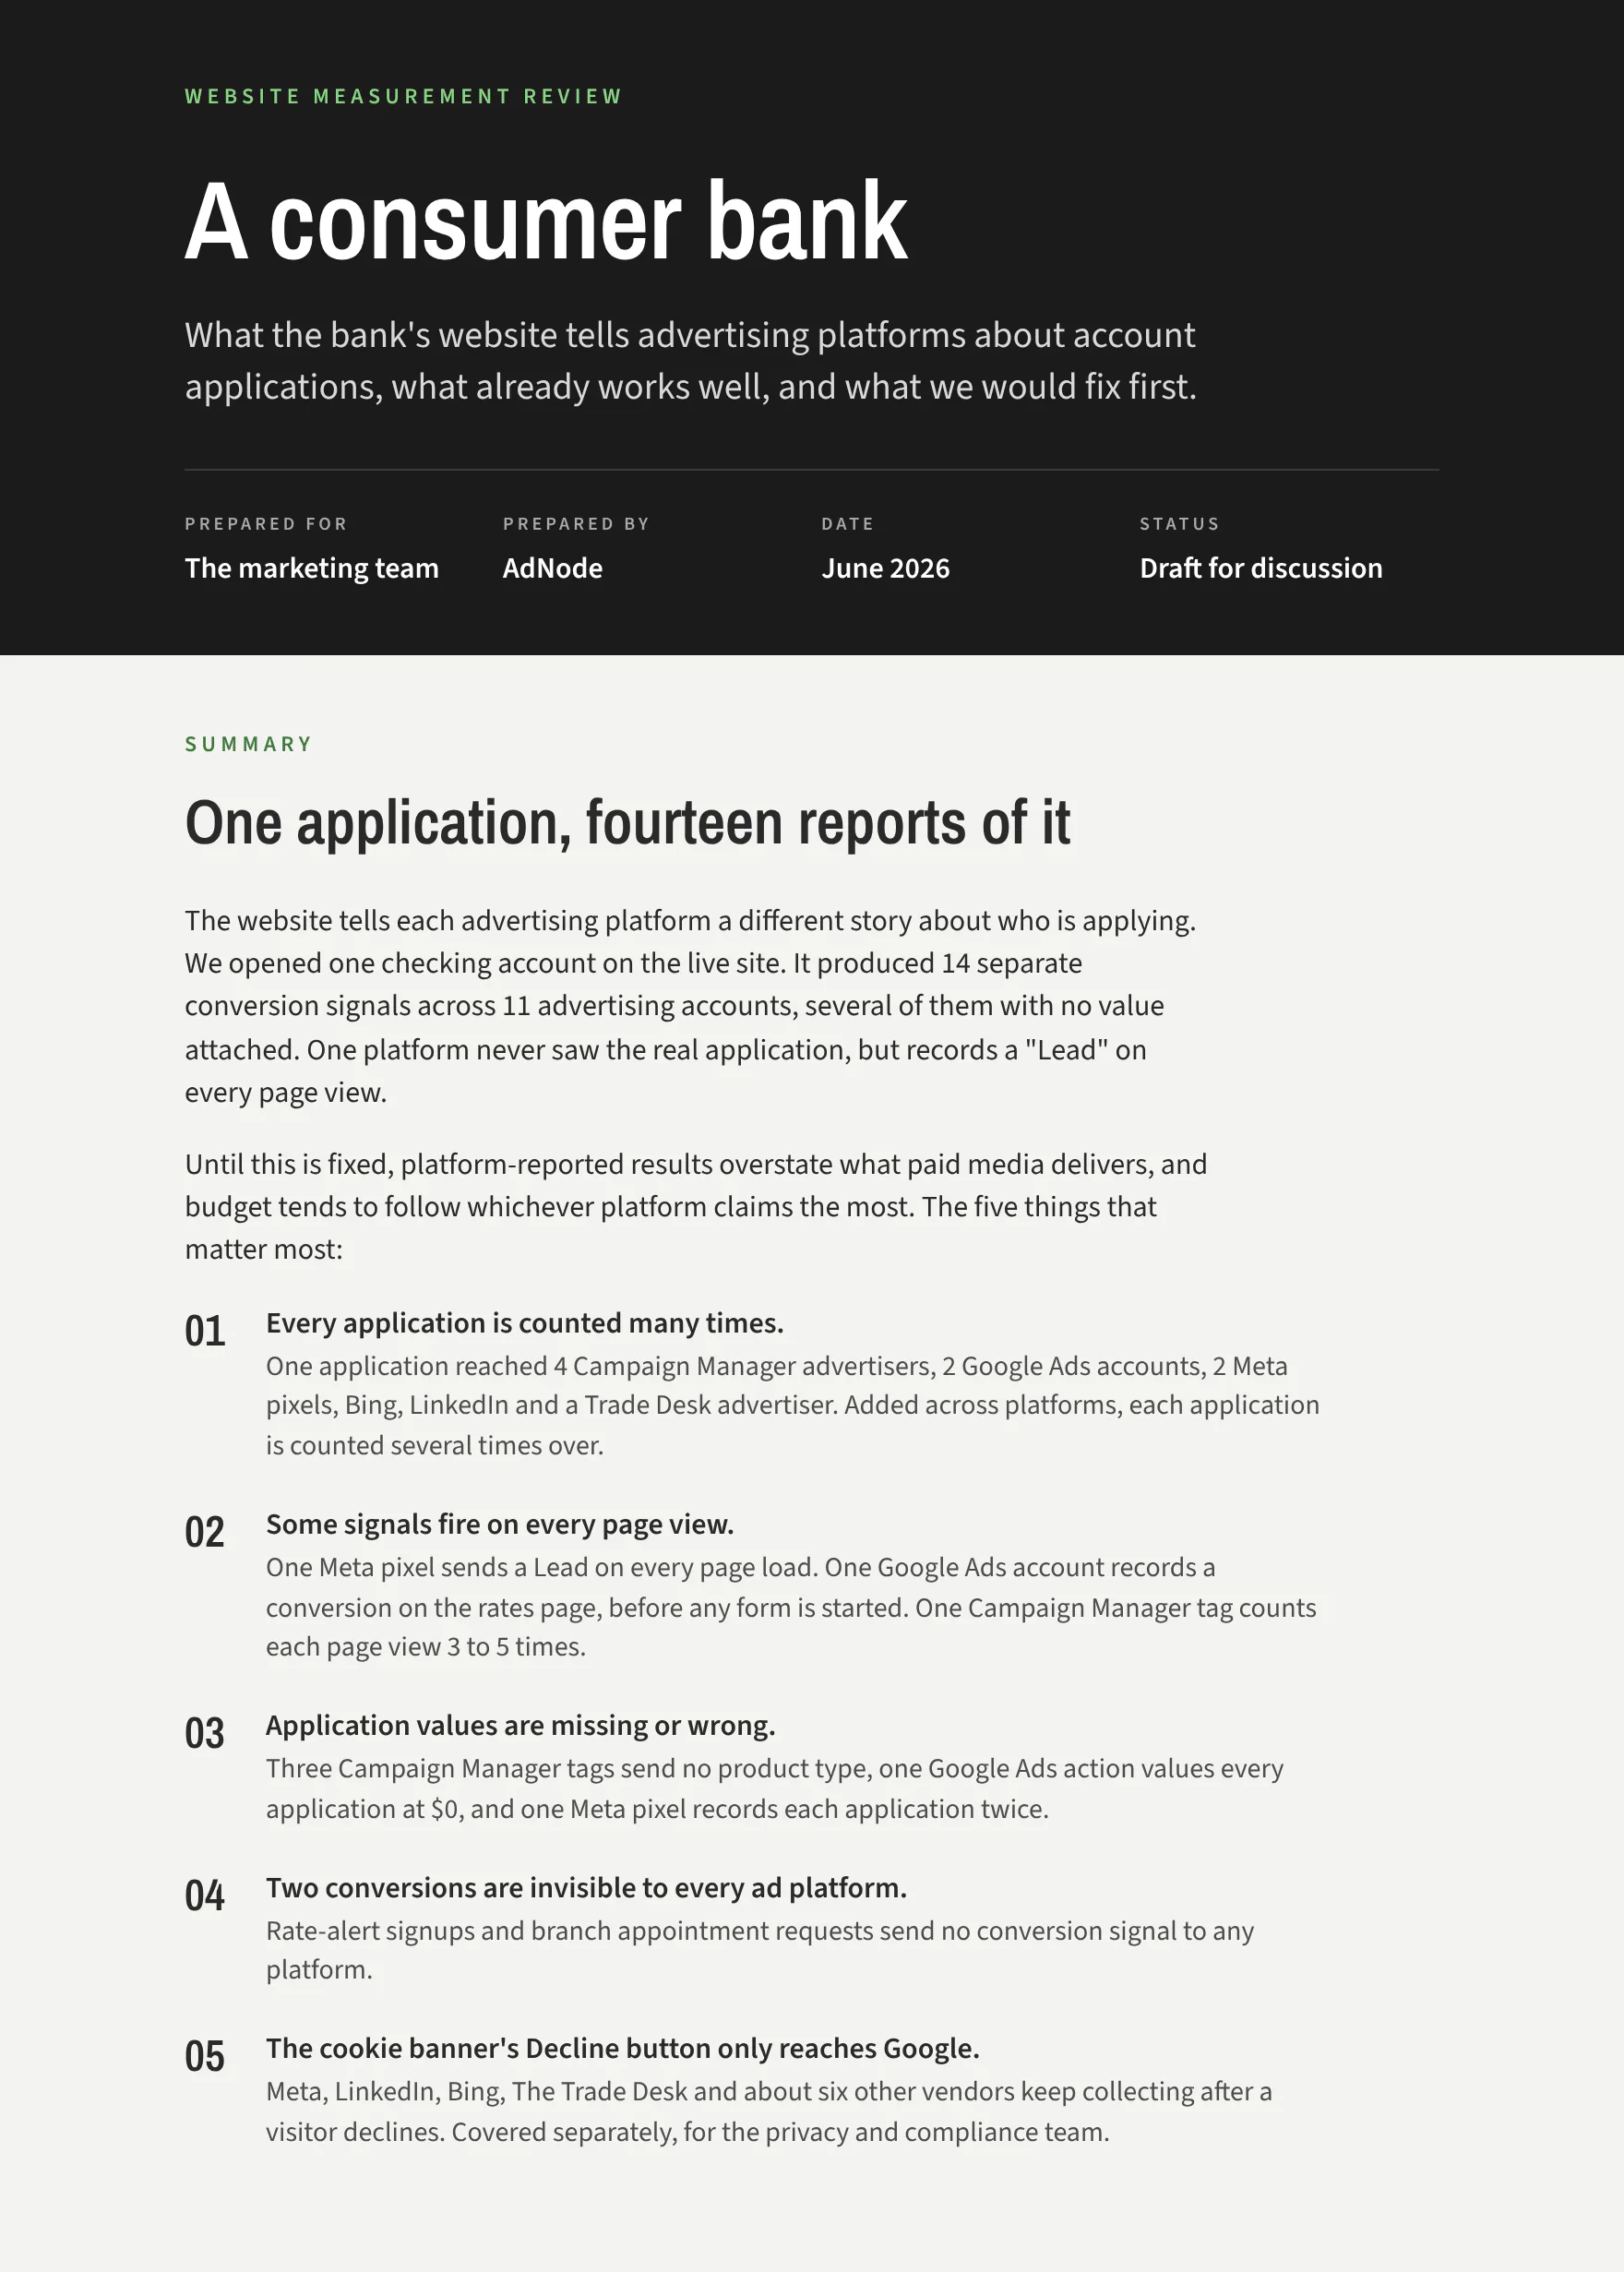
A review fits on a page. For a bank, opening one checking account produced fourteen conversion signals across eleven ad accounts, and the five things that mattered went to the marketing team and the compliance team in the order to fix them.
The same scrutiny applies to our own numbers. When the reported cost per site visit on a connected-TV campaign came to about $30, we said so, and then explained why the true figure was likely nearer $10: without a shared identity signal, only about a third of visits can be tied back to an ad exposure, so the visits the platform can see are a fraction of the visits the ads produced. A number you can’t defend is not a result, and neither is one you quietly inflate.
An audit ends with a choice, not a list. There is a path where you fix the handful of things that let you run well within a few weeks, and a path where the list never gets shorter. We tell you which items are on the first path.
How you compare: competitors, AI assistants and the market
Some of what moves your objective happens where your campaigns don’t run, and a result means little without the competitive set beside it. We measure that too, under the same definitions.
What AI assistants say about you. Each week, a panel of questions a buyer in your category would ask is put to Claude, ChatGPT, Gemini and Grok, once with web search on and once without.
You see how often you are mentioned, your share of mentions against the competitors you name, which questions you are absent from, and whether the assistants even call you by the right name.
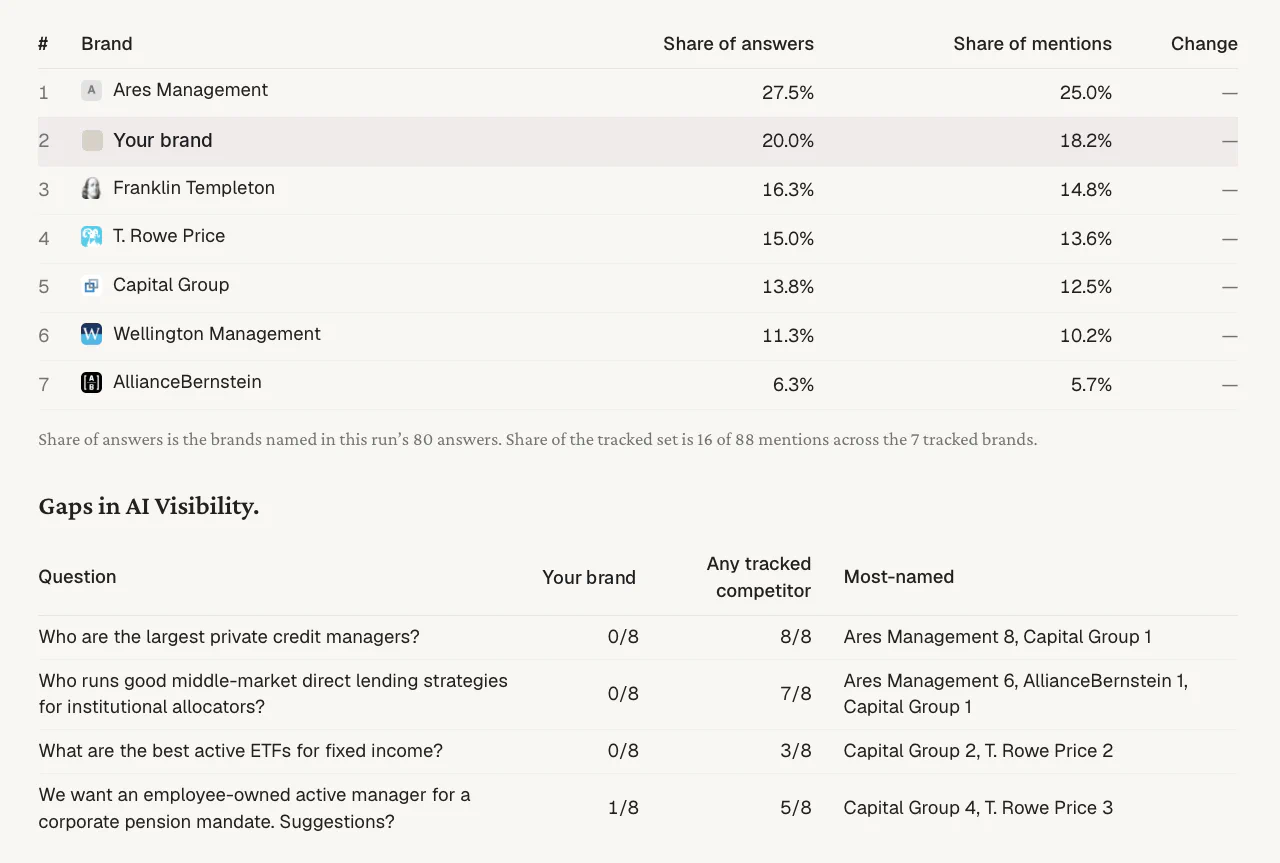
Brand studies against your top competitors. Awareness, consideration and preference are asked about you and the brands you compete with, in the same survey, so a lift is read against the field and not in isolation.
Your competitors' ads. What they are running, where, and with what message, pulled weekly and reported next to yours, so a change in their spend or their creative is visible the week it happens.
Share of the auction. Impression share and lost share on paid search, audience penetration on LinkedIn, and the inventory constraints on private deals as the DSPs report them, which tell you how much of the market you are reaching and how much is left.
Market color. We talk to the sales and programmatic teams at the publishers and platforms we buy from. What they see across their book, who is bidding, what is clearing, what is coming, is part of your read, with the source named.
The answer is on the first line
Every report we send starts with your objective, continues with the KPIs that predict it, and ends with the media metrics that explain it. Each metric has one definition, every finding carries its evidence, and a person’s name is on every report that leaves this firm.
If a number in one of our reports can’t be explained by this page, that is a defect in the page. For the thinking behind the framework, see Brand campaigns that stand up to CFO scrutiny; for the channels we buy, see what we buy.