Every client signs in to one place. It holds every channel we buy, your site analytics, how AI assistants and competitors describe your market, and every presentation we have made to you, organized in the order How We Measure describes: your objective first, the KPIs that predict it, the media metrics as diagnostics. It refreshes through the day. It comes with every engagement and is never sold on its own.
The screens below are from live accounts, with the clients’ names and campaign names replaced.
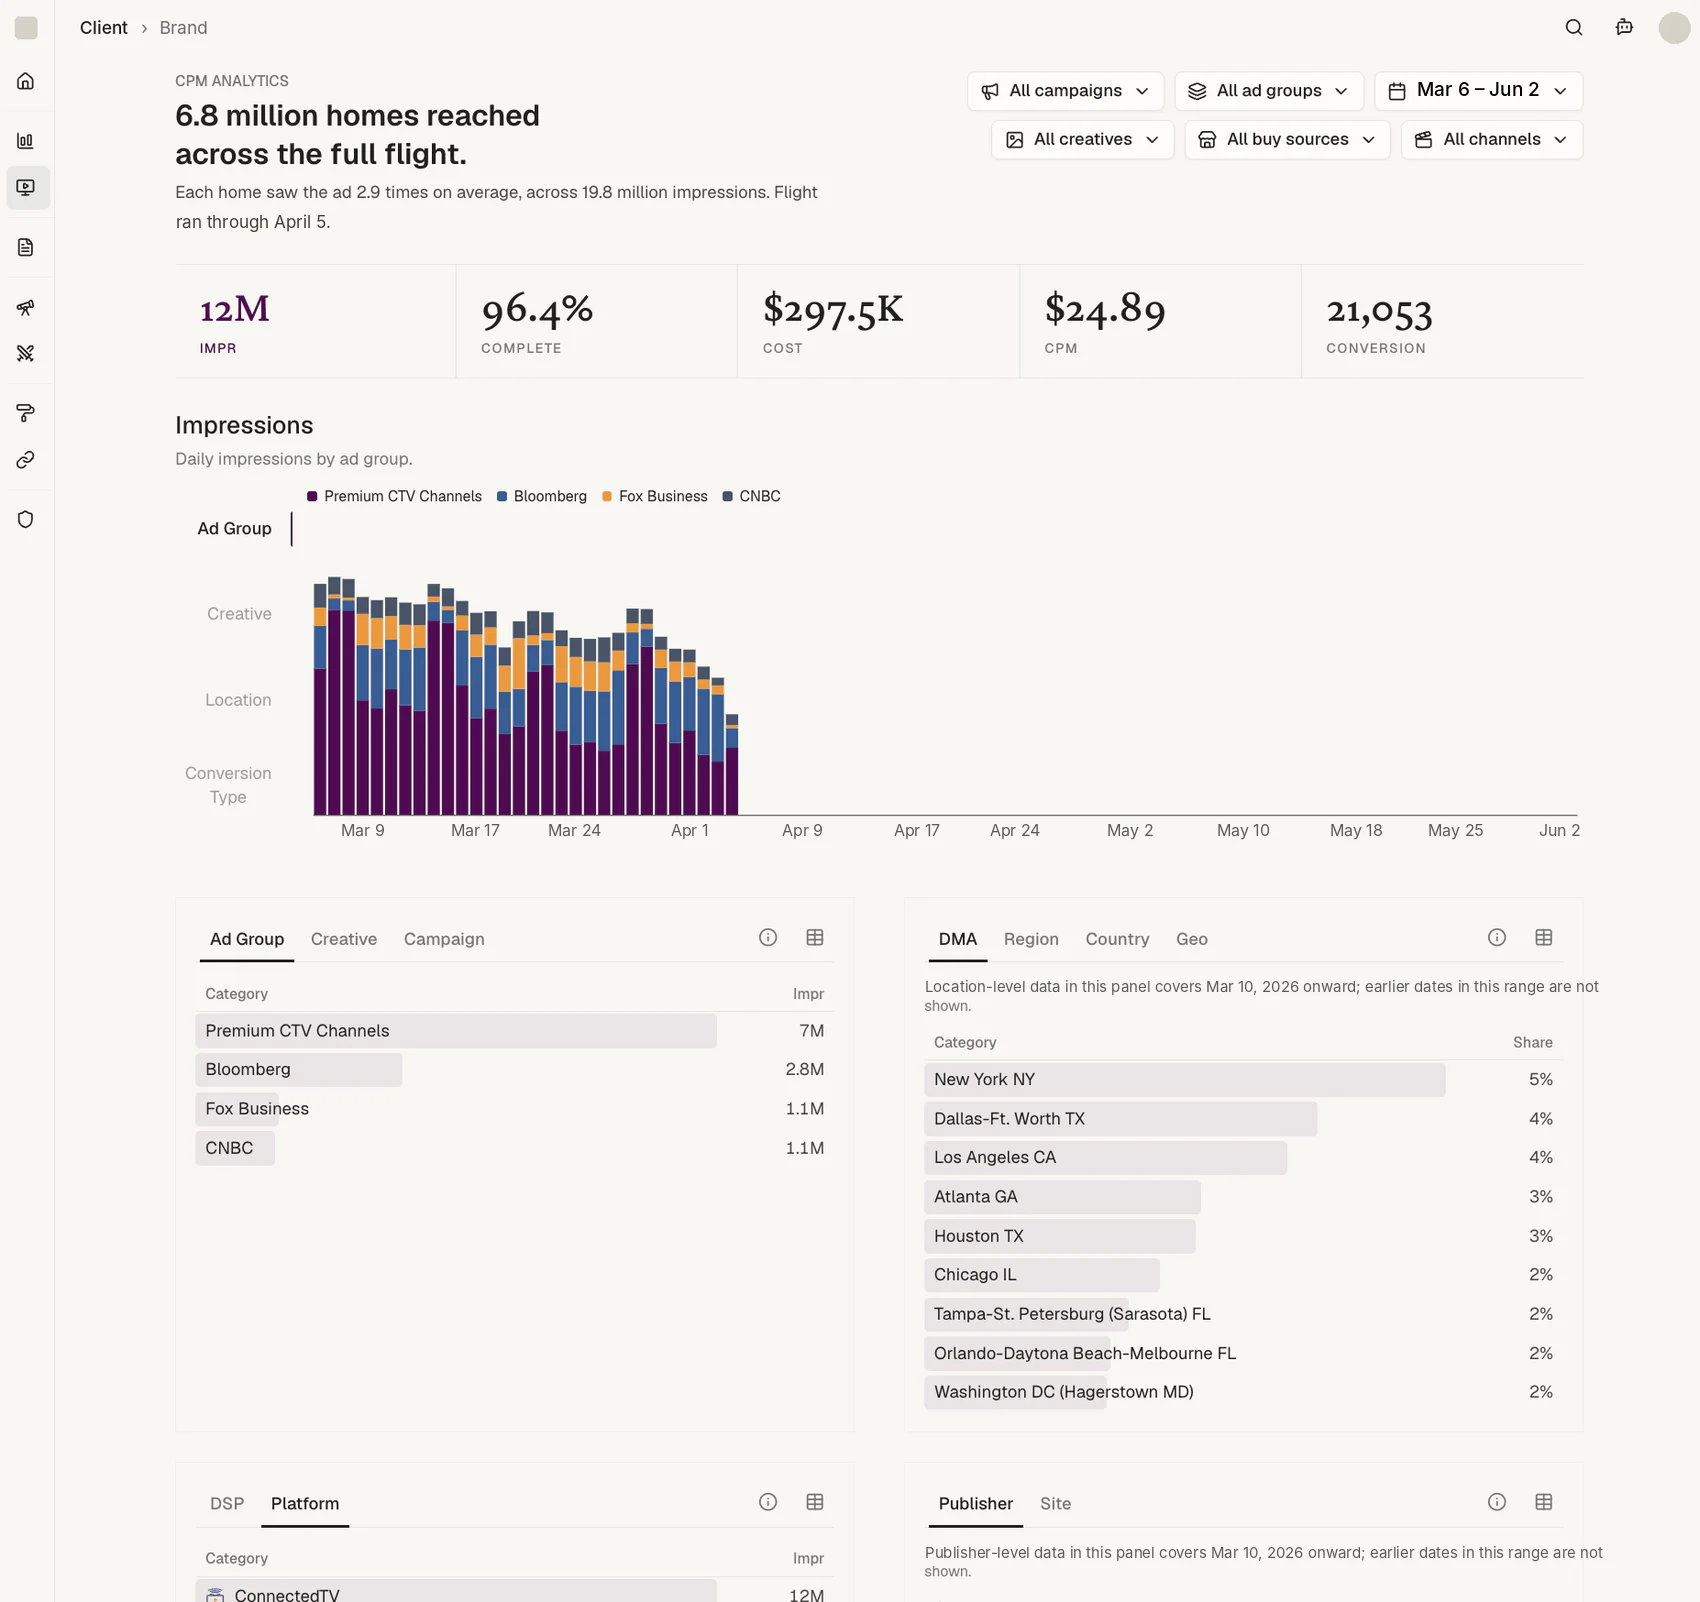
Connected TV and programmatic. Reach as a sentence, one campaign at a time, because unique reach does not add across campaigns. Then the KPI strip, delivery by ad group, creative, market, device, publisher and conversion type, with every filter a click away.
The conversions column is defined in your terms, not the platform's.
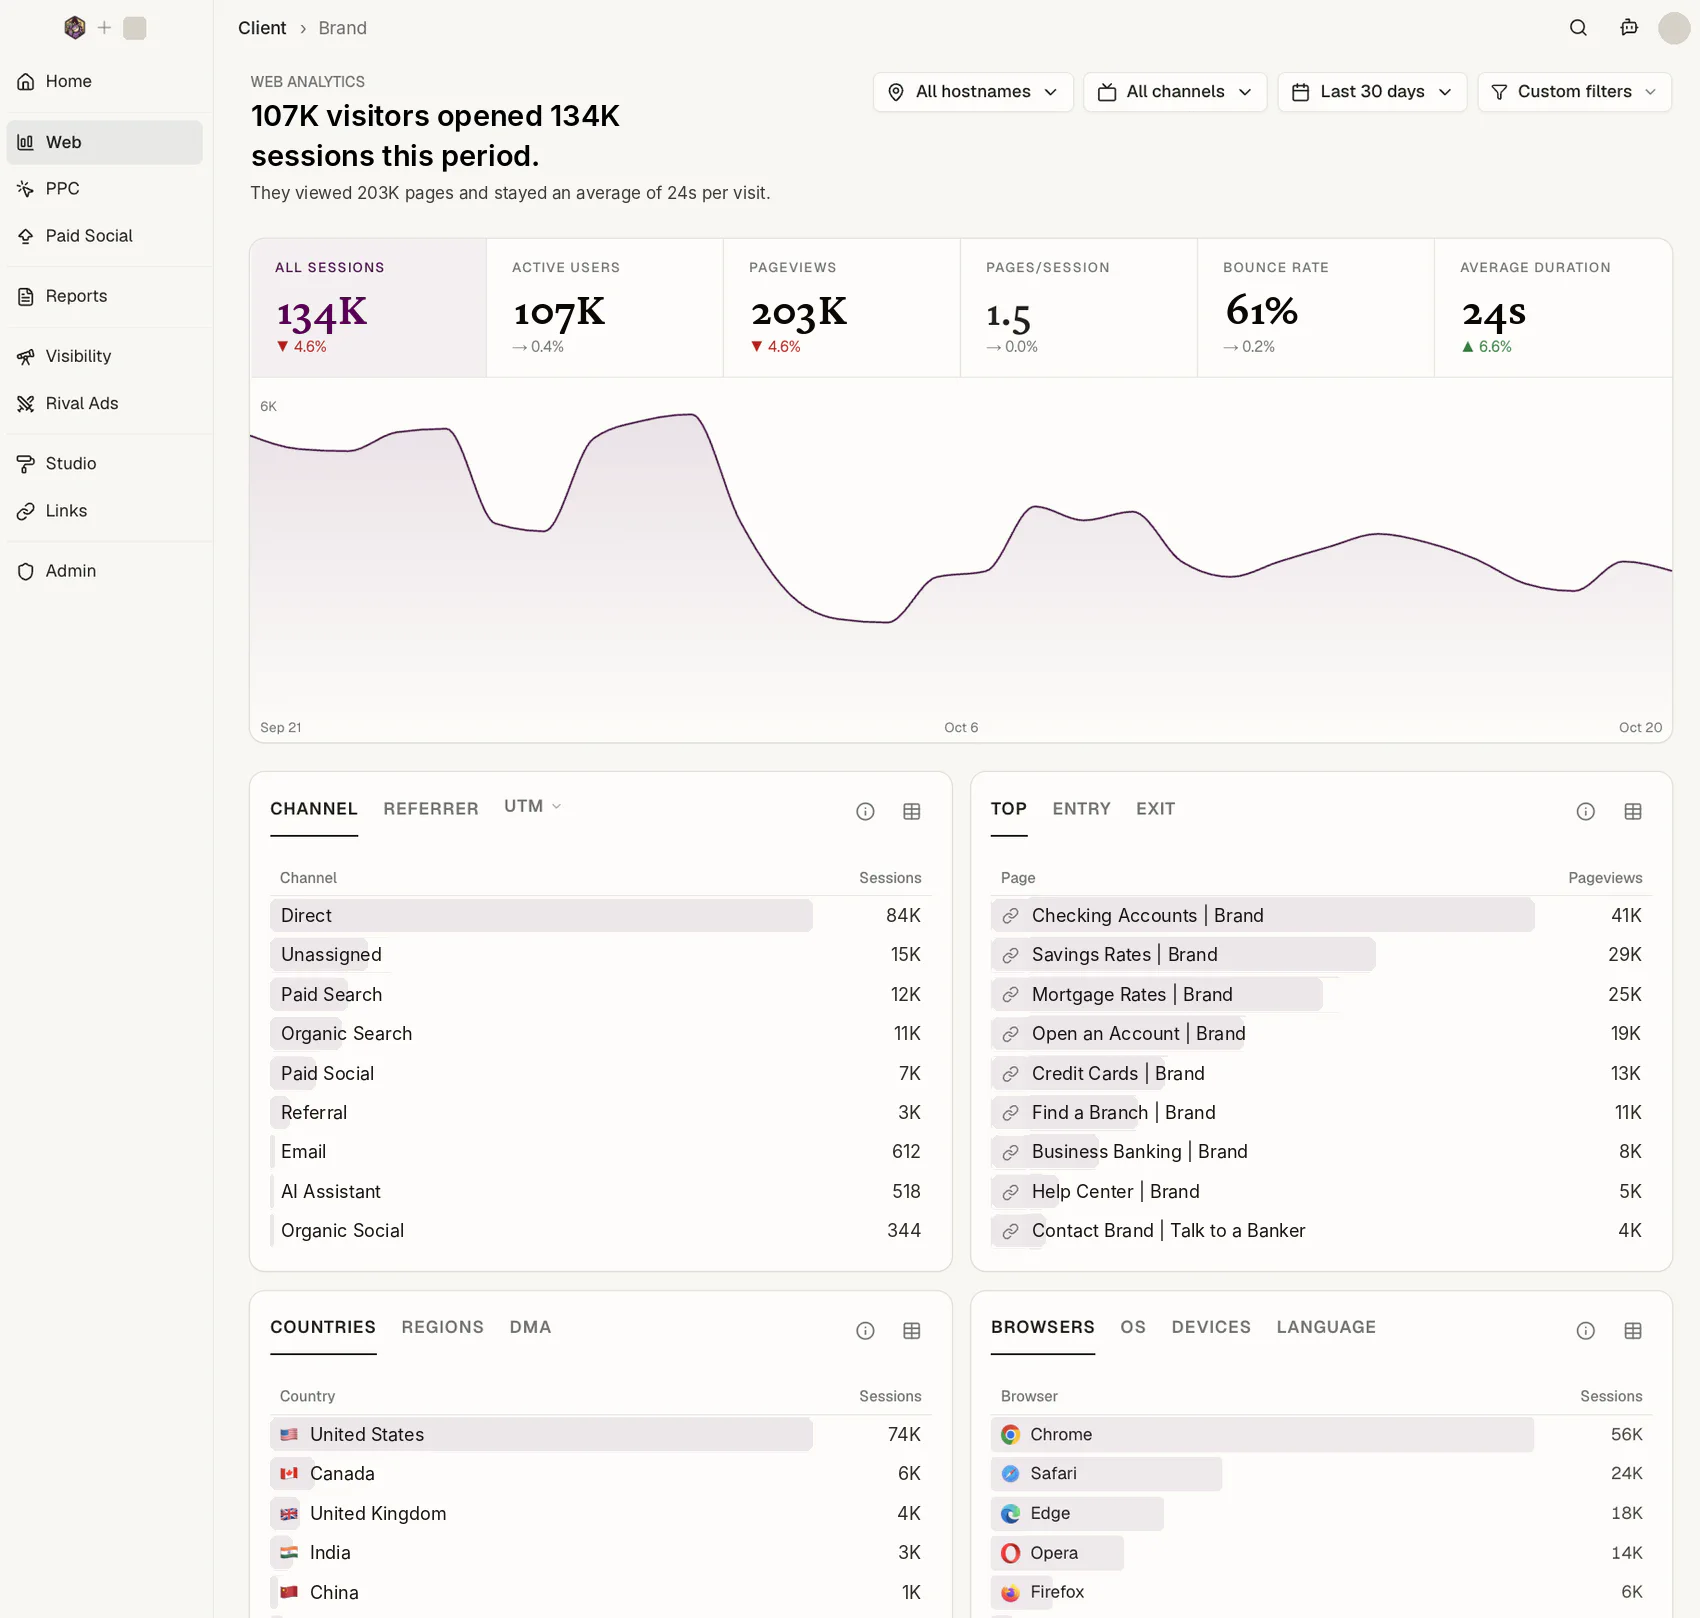
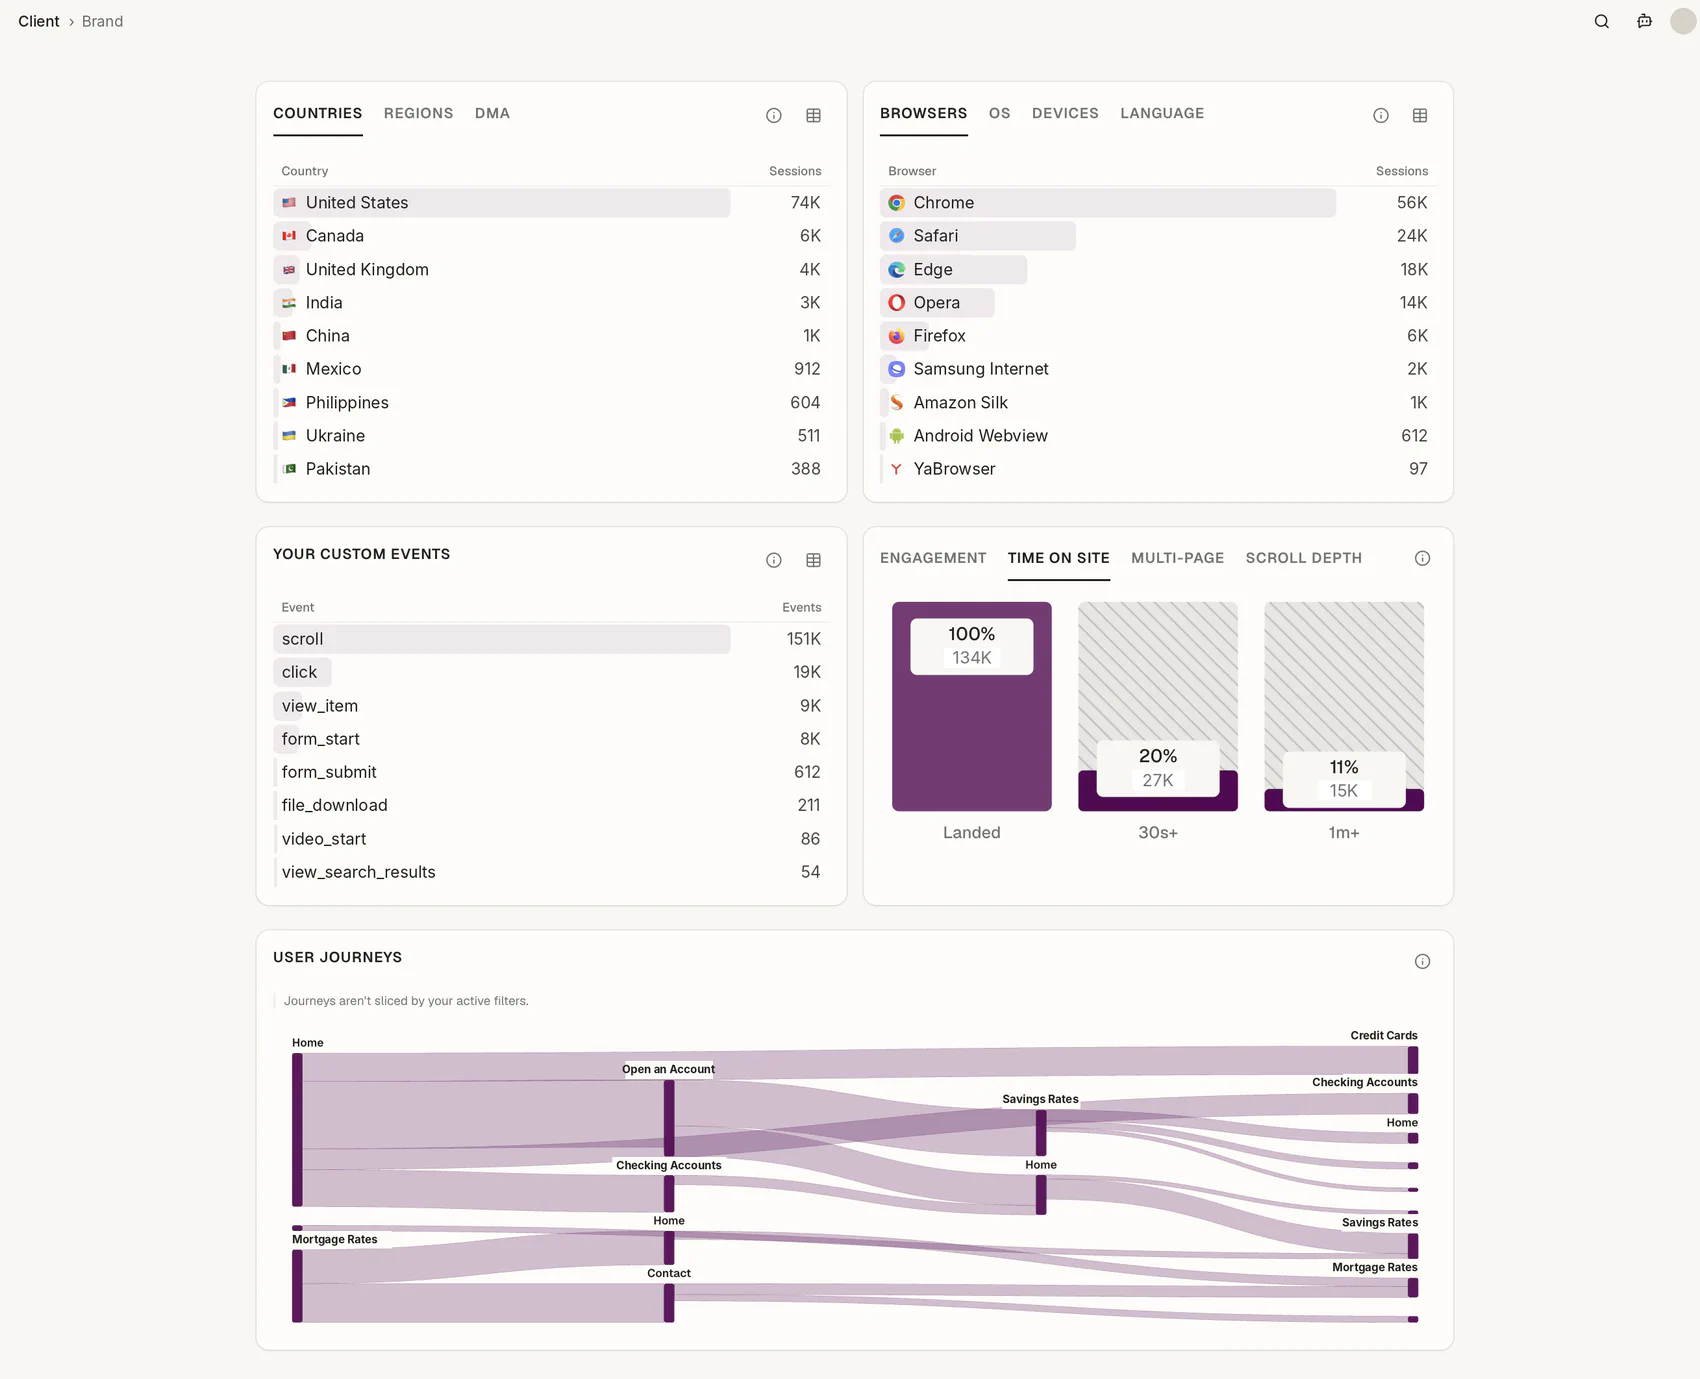
Your site, by channel. Sessions, pages, bounce and time on site from your own analytics, split by the channel that brought the visitor, so paid search, paid social and connected TV are read against direct and organic traffic. Which pages they landed on and left from, by country, region and market, by device.
This is where lead quality is checked: a channel whose visitors stay is sending the right people. Further down the same page: how long they stayed, what they did, and the paths they took through the site.
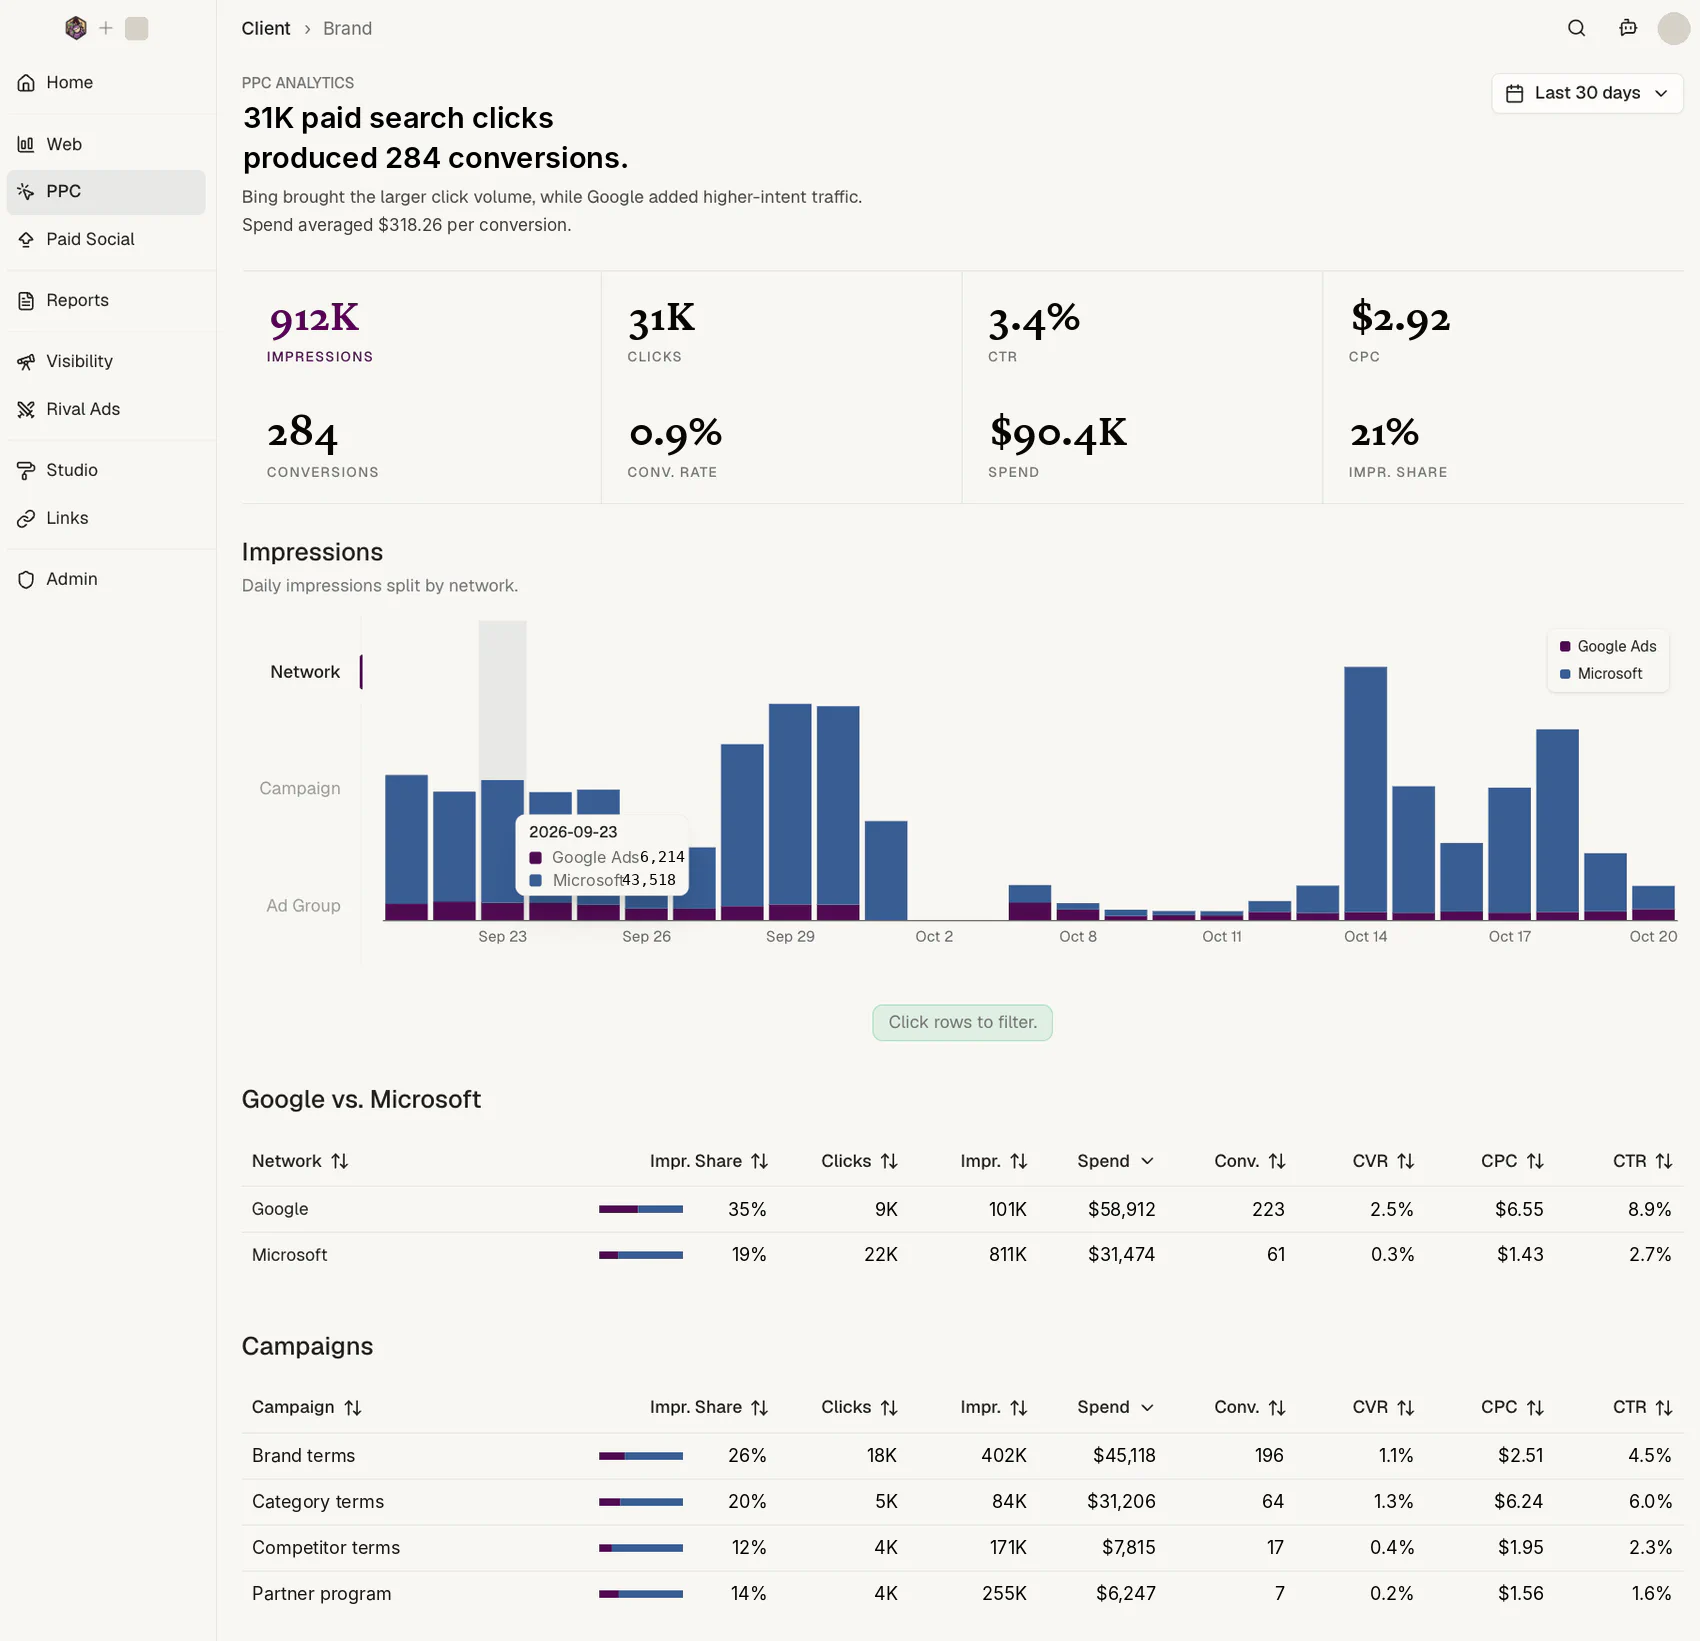
Paid search. Clicks, conversions and cost per conversion by network and by campaign, with impression share beside them, so you can see how much of the demand you are reaching and how much is left.
Google and Microsoft in one table, because the question is never which engine did better, it is which keyword group's leads cost what.
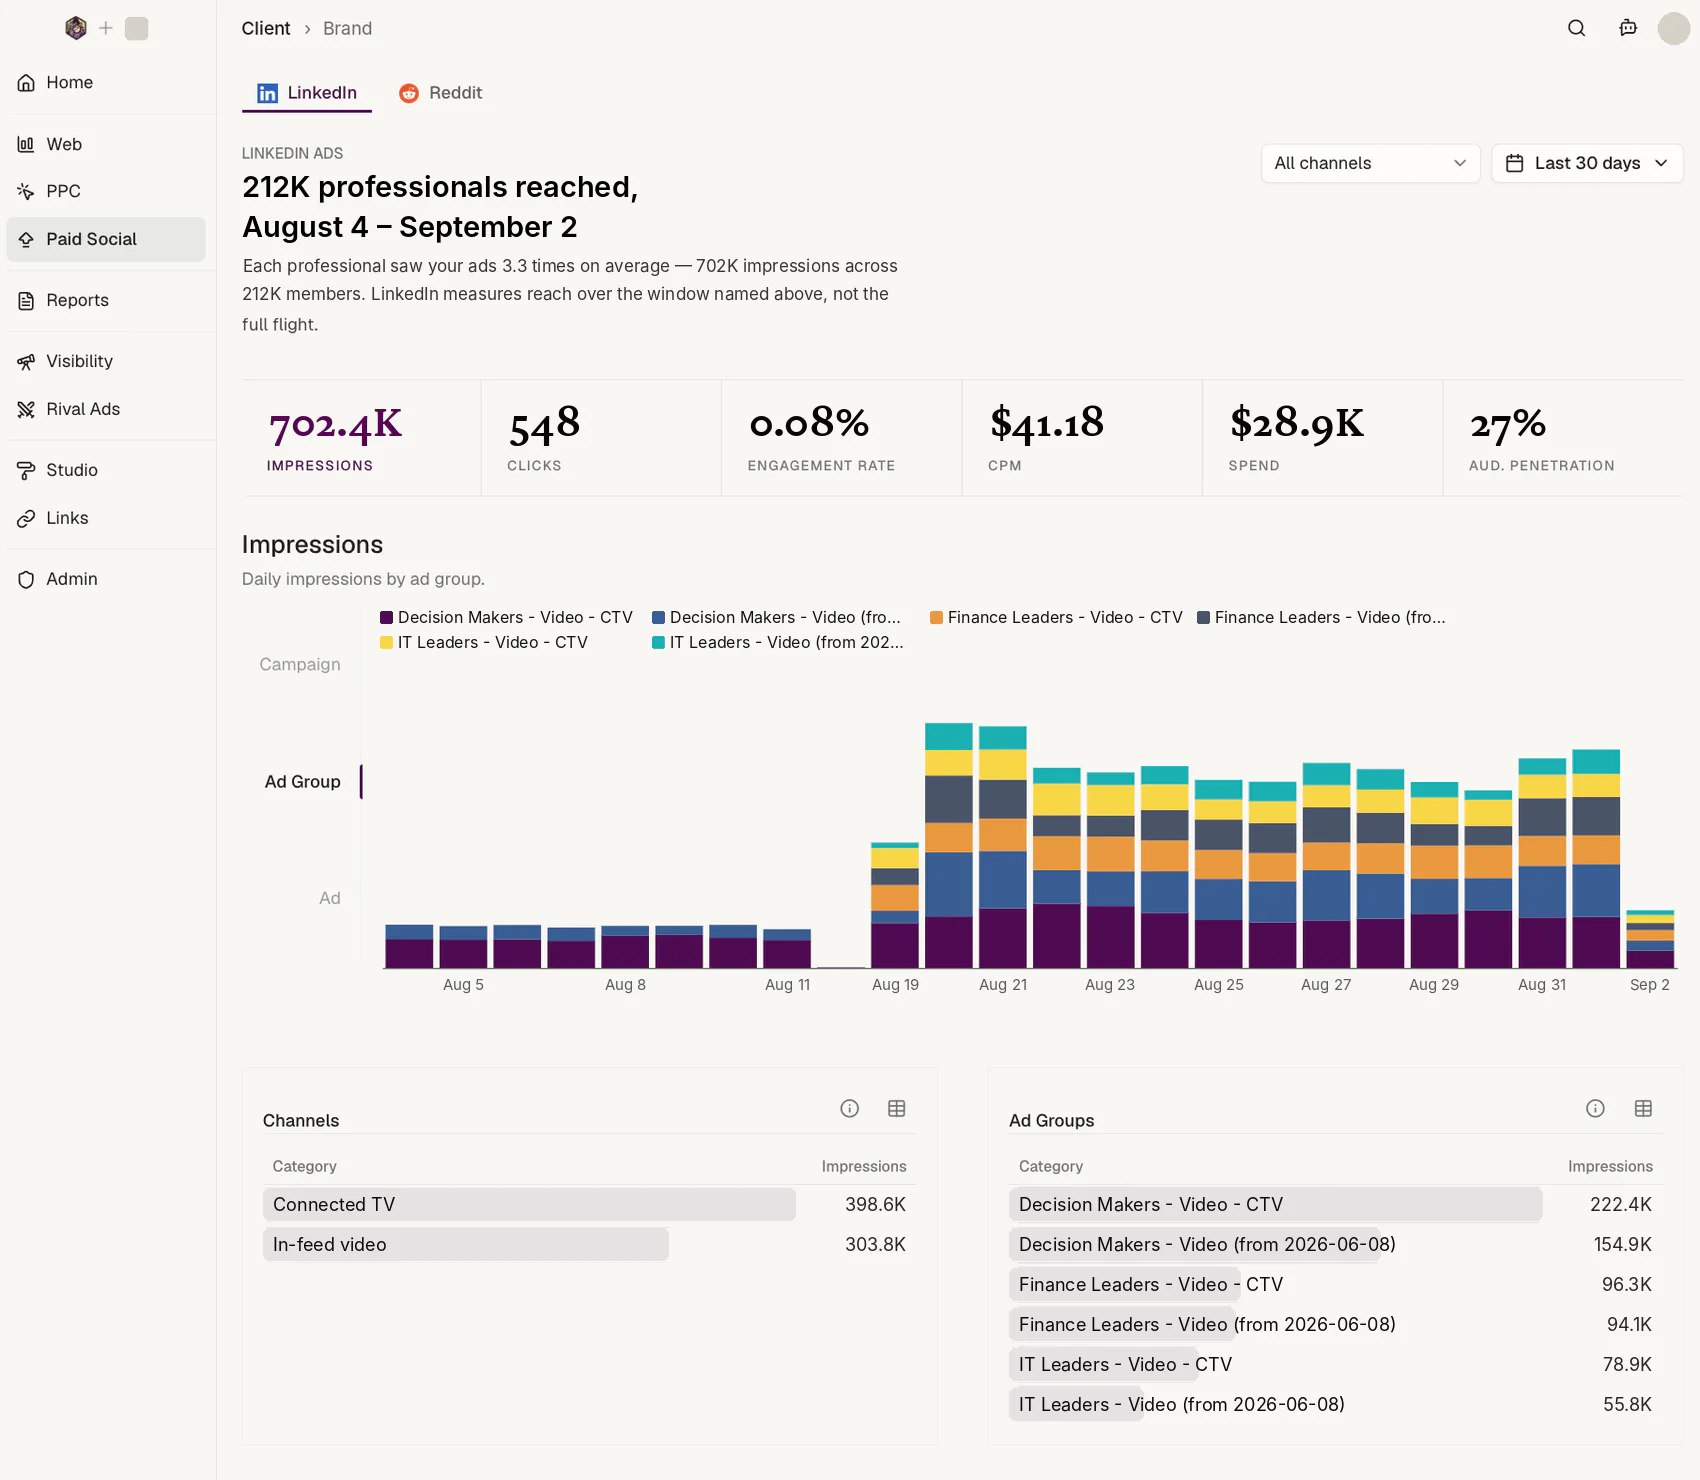
Paid social. LinkedIn with reach, frequency, engagement and audience penetration, by ad group, job title and industry, so a professional audience is measured as people reached rather than impressions served. Reddit by community, keyword and placement.
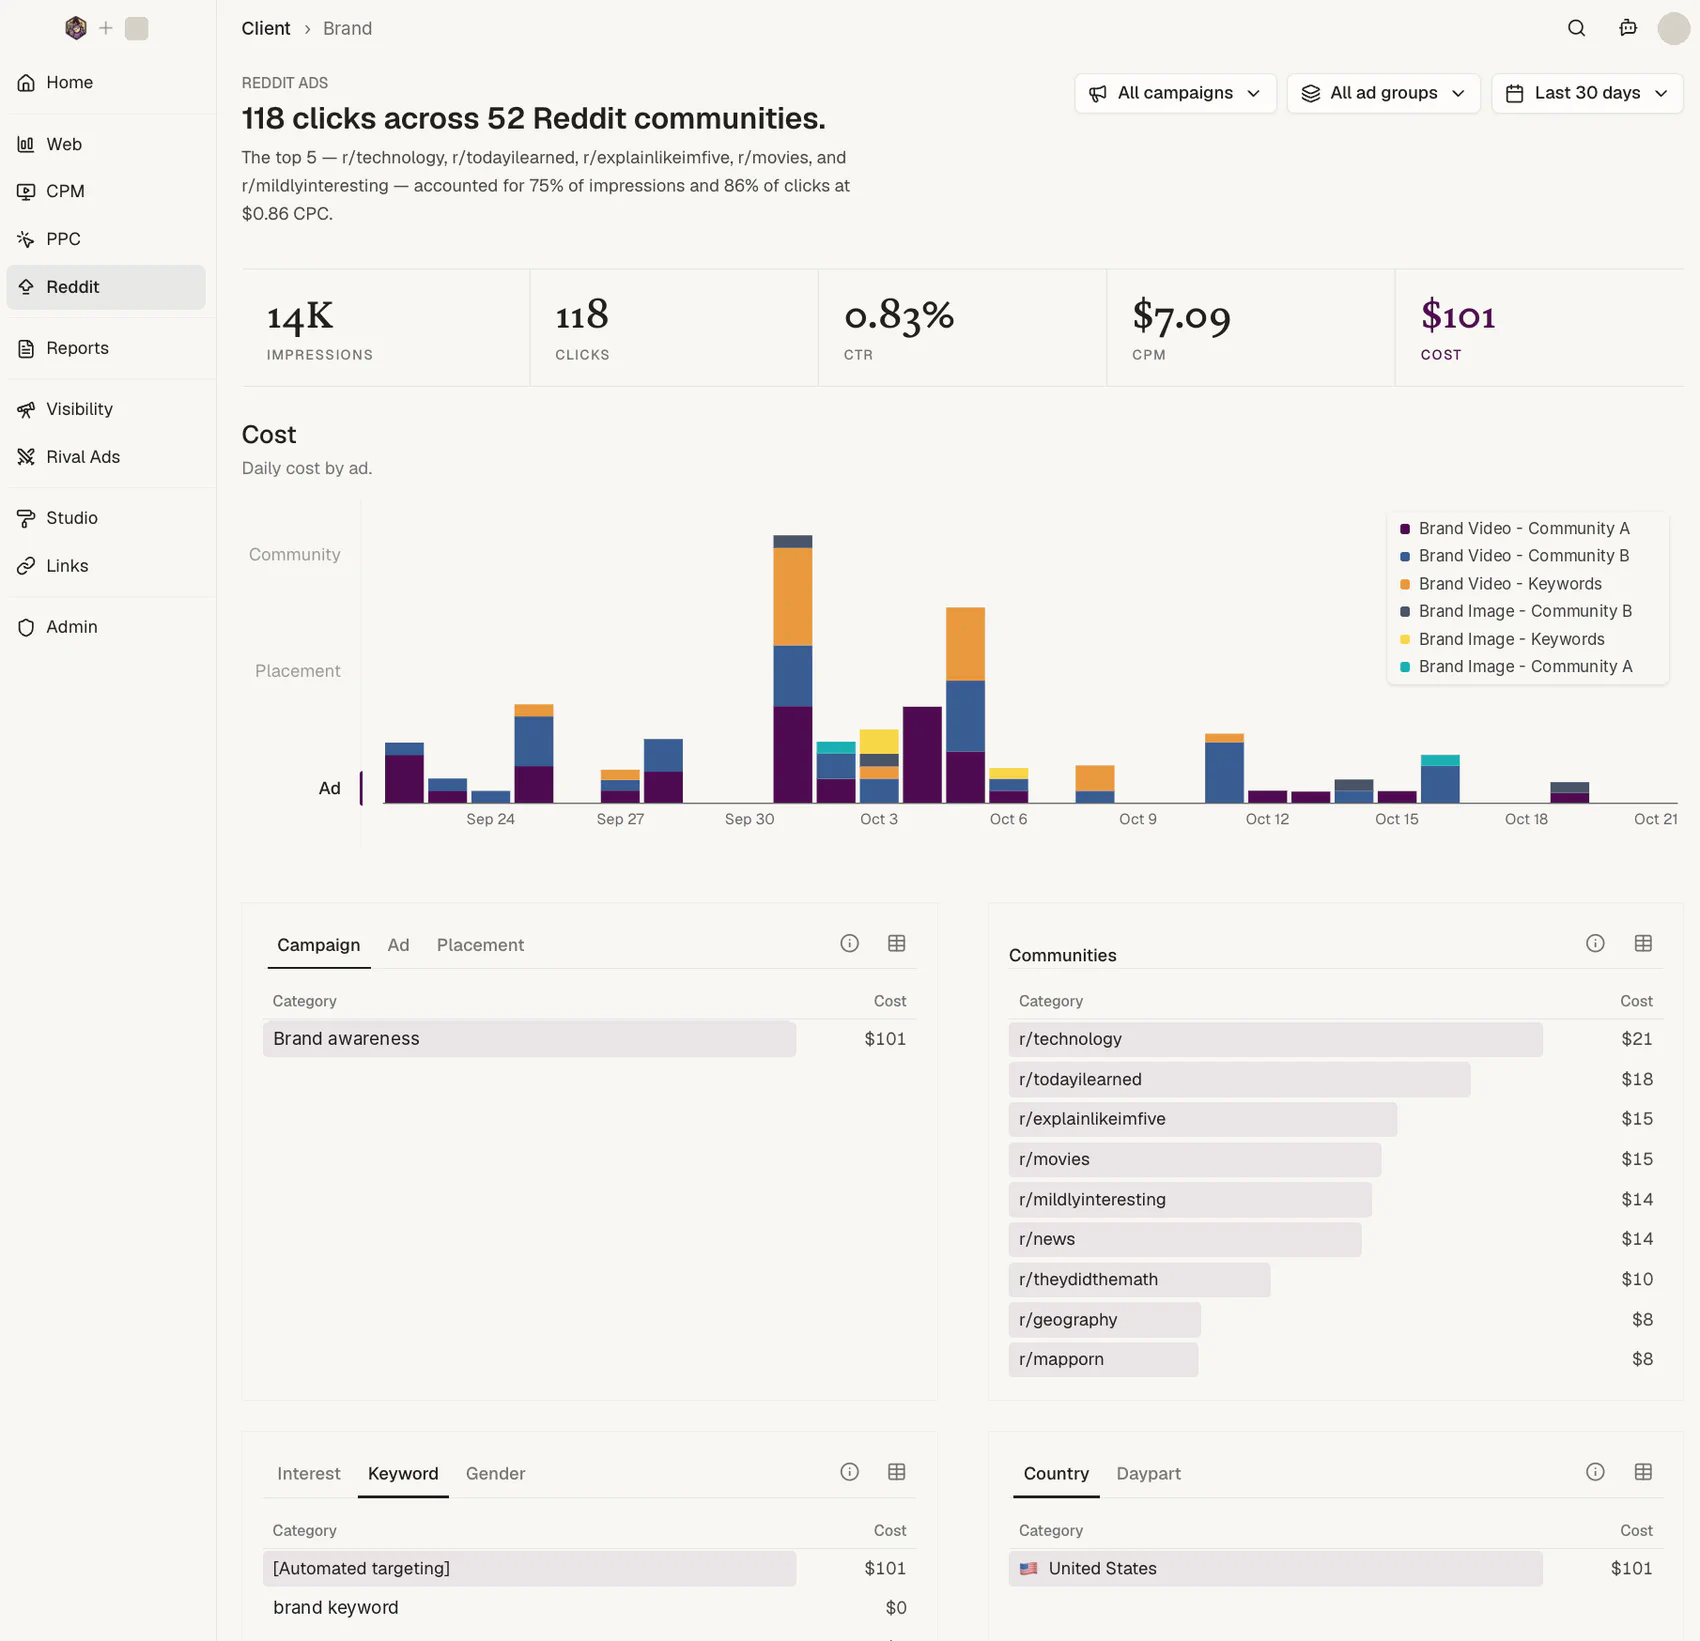
Reddit. Cost and clicks by community, with the top communities named, so a channel built on context is read by the context that worked.
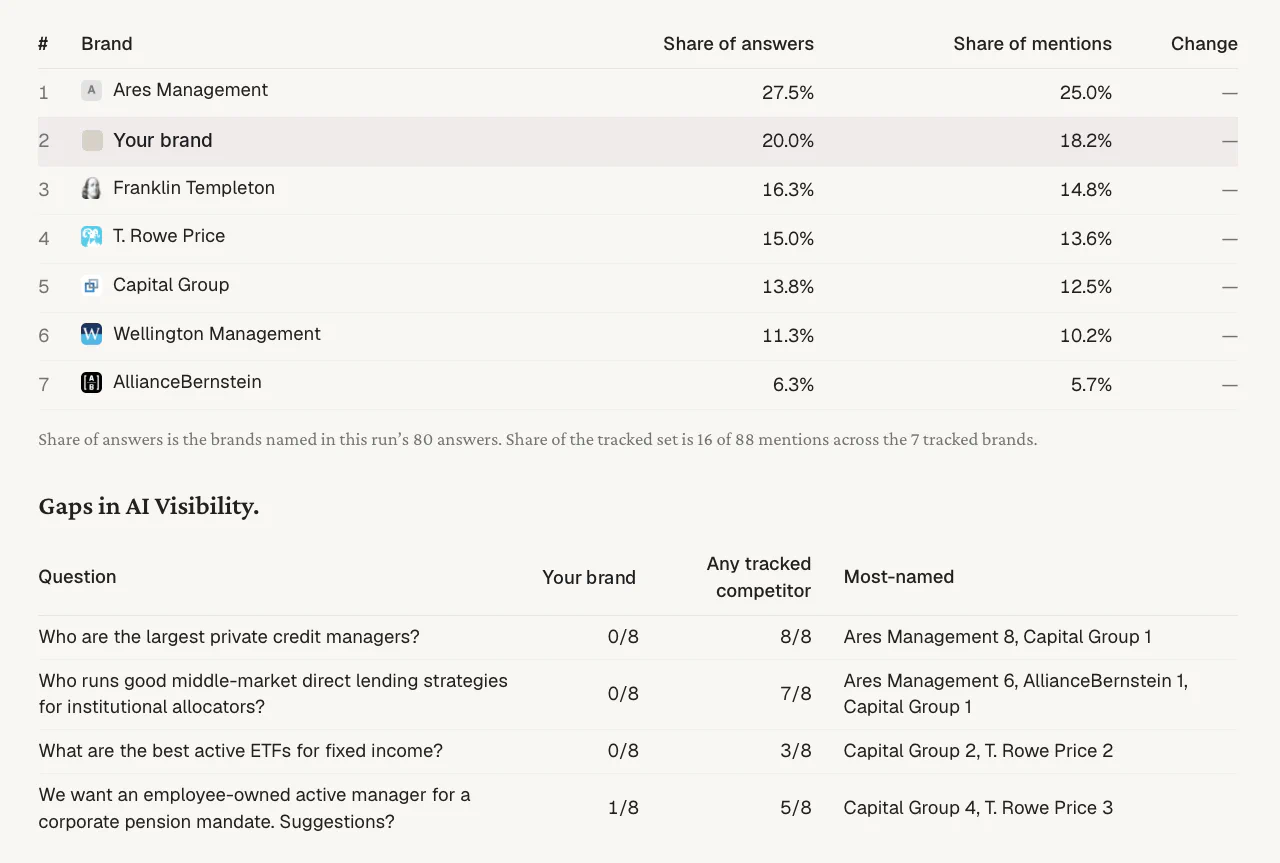
How AI assistants describe you. The same questions a buyer in your category would ask, put to Claude, ChatGPT, Gemini and Grok every week, with web search on and off. Your share of answers and mentions against the competitors you name, and the questions you are absent from, with who was named instead.
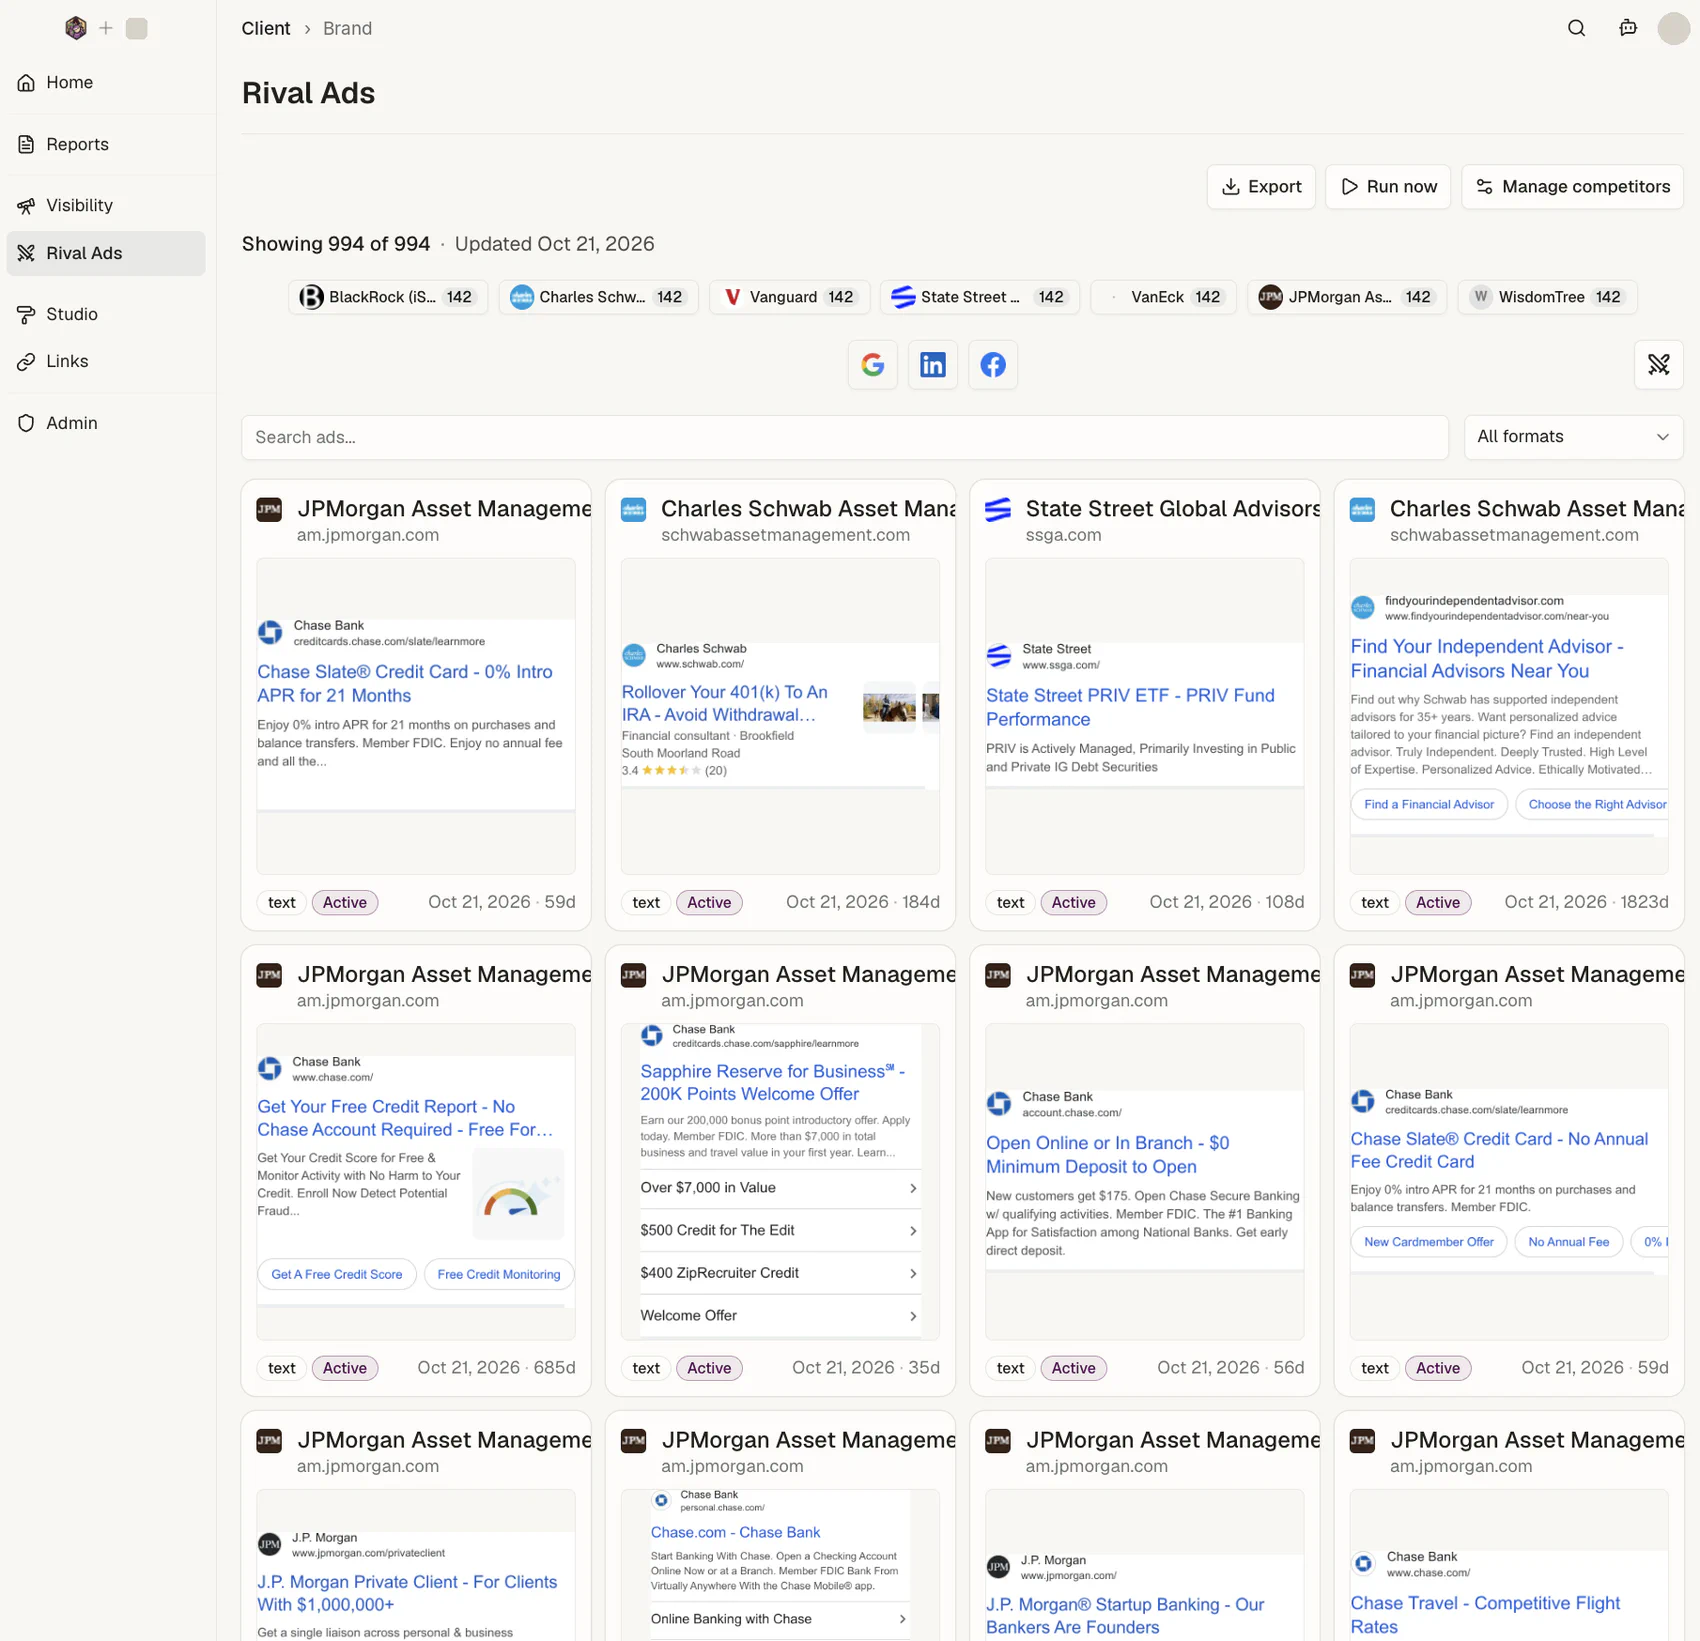
Your competitors' ads. What the brands you track are running on search, LinkedIn and Meta, pulled weekly, searchable by format and message, with how long each ad has been live. A change in a competitor's spend or creative is visible the week it happens.
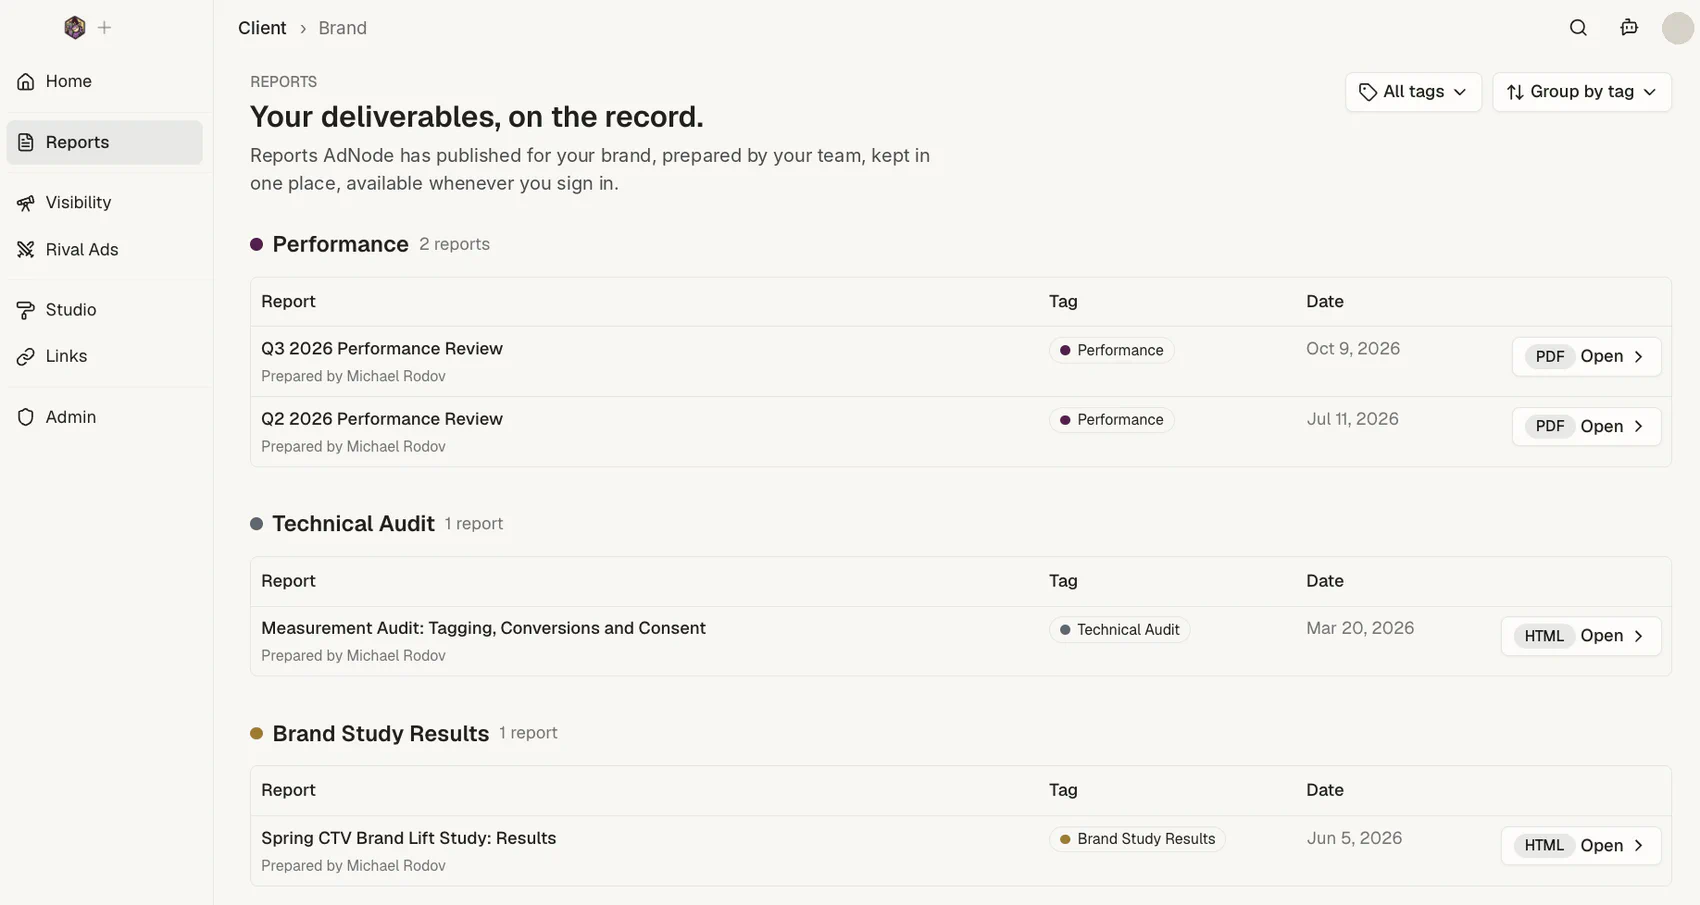
Every presentation, beside the numbers. Performance reviews, media plans, brand study results, technical audits: everything we present to you is published here, tagged, with who prepared it and when, next to the media results it was drawn from. The context behind each decision stays with the numbers, so every campaign builds on the last.
What it is not
It is not a seat. Nobody buys it, and it is not configured by you; it is built around your objective by the people who run your media. It is not a dashboard of everything; it is the figures we have decided matter, in the order they matter, with the ones we leave out left out on purpose. And it is not a substitute for a conversation: the first line of every page is where the next call starts.